A couple weeks back, in this article, I highlighted a few public domain resources for needlework, one of which included lots of illustrations of filet lace, which is a kind of woven needlelace that’s produced on a square net ground.
The topic generated some questions from various readers about using filet lace patterns – which are gridded – as cross stitch (and other counted work) projects.
In the course of the discussion, the question of how to “read” the filet lace as a gridded chart came up. Sometimes, when you’re looking at filet lace illustrated in these old publications, you’re seeing black and white photos of the completed woven pattern, which can be much more difficult to read than a chart would be.
The easy solution is to chart the filet pattern. There are a couple ways you can do that. Let’s talk about how, using this particular image:
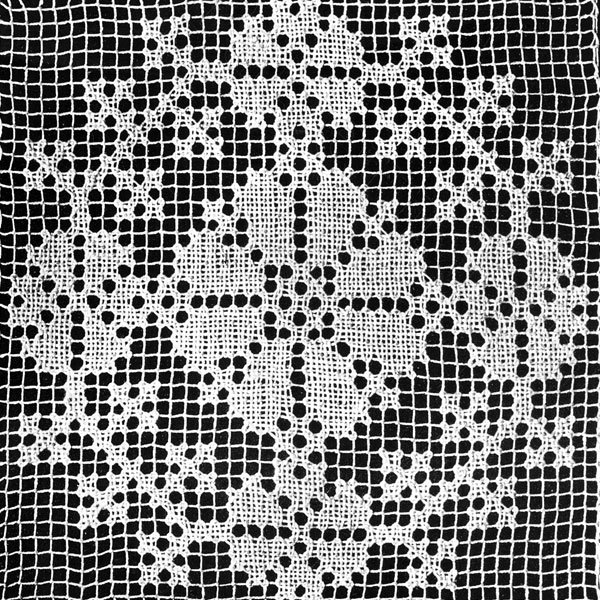
The easiest, least-learning-curve approach to charting the image above would be with a pen and a piece of graph paper. You can easily find 8-square-per-inch graph paper in the drafting section of office supply or art stores. It comes in different sized tablets. If you’re into charting, a tablet of this type of graph paper is always a good resource to have at hand.
Use a pencil or pen, and “chart” the design above by filling in squares on the graph paper that corresponds with each filled square in the filet lace design. Voilá! You have a chart.
If you want to expand on that design, though, or you want to alter it, enhance it, and so forth, it is Much More Efficient to do this type of charting on the computer.
Computer Program for Charting
For those who are really interested in producing charts, either for your own pleasure or for business purposes, it makes sense to invest in some kind of charting software.
For example, years and years and years ago, I wrote this article on how to work variations of blackwork patterns, followed by this article on even more variations of the same pattern.
If I had to hand-draw all those repeated elements over and over and over again on graph paper, it would not have been a very efficient way to come up with a lot of variations in a pattern.
I produced the variations using a charting program called MacStitch by Ursa Software. (No affiliation – just a satisfied user.)
Later, I also wrote this article about MacStitch, showing the charting of a design.
This last article was writing in 2012 – twelve years ago – which is something like 200 lifetimes in software years. Still, even after twelve years, MacStitch is what I still use when I want to chart anything. It has undergone numerous upgrades over the years. It’s an easy, user-friendly, affordable charting program.
I use the MacStitch version because I’m on a Mac, but they also have a PC version.
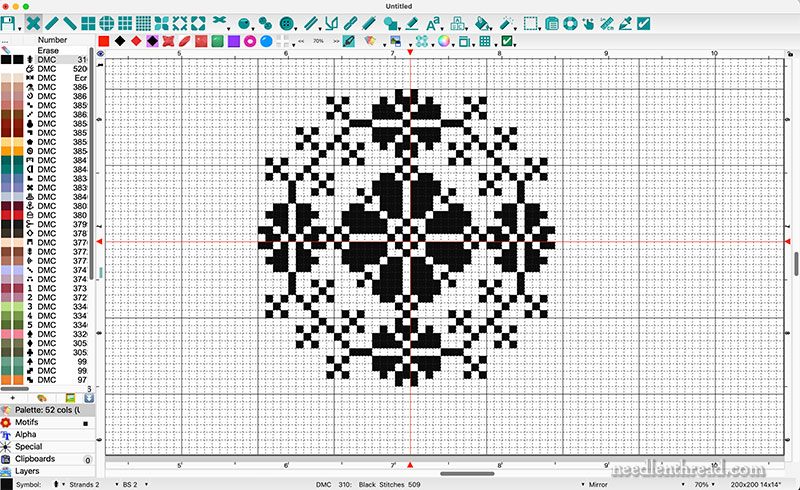
When charting on a charting program, it’s the same concept as charting on a piece of graph paper – you simply fill in the boxes that correspond with the filled squares on the filet image.
I’m not really focusing here on a tutorial for using MacStitch – there are tutorials available online to help you over any learning curve with this type of program – but just showing you that translating the photograph of the finished filet into a chart is just really a matter of counting and plotting filled squares.
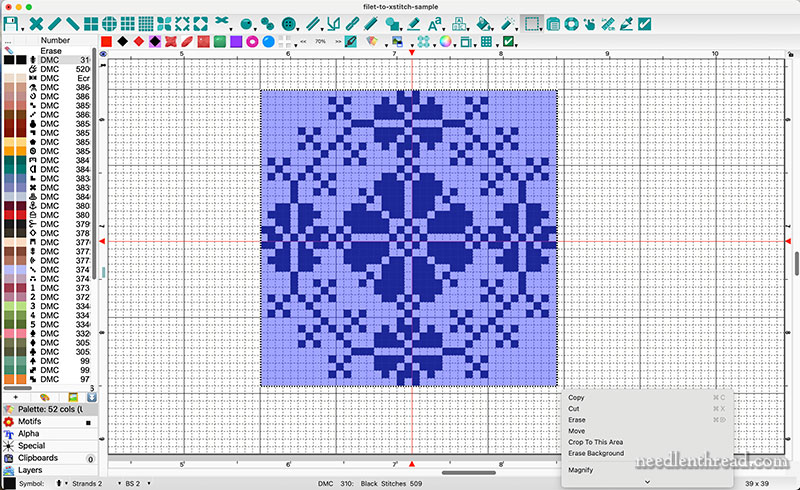
The Very Efficient Aspect of working with charting software is that you can easily highlight parts or all of a chart and, with the click of a button, duplicate the elements you want to duplicate. This allows you to quickly build or manipulate a design.
You can mirror the design, flip it, and so forth – all in the blink of an eye.
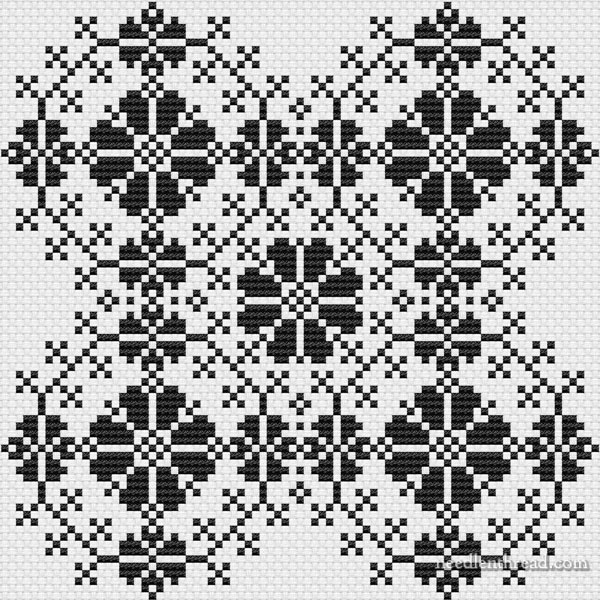
It takes mere seconds to expand a chart with repeating motifs.
So, for those who have asked, that’s how I’d go about making old images of filet lace from public domain works into easy-to-read charts.
If you’re not into computers and software, graph paper is your friend! I recommend looking for the kind that’s “tracing” paper (you’ll find it in the drafting section), so that you can more easily manipulate repeatable motifs and make better decisions on layout, before having to draw up every repeated part of the chart.
I hope this little bit of information helps you in your explorations of this aspect of needlework!



Hi Mary,
I’ve always enjoyed making crocheted lace using filet lace patterns, so it was a joy to see it today. When I zoomed into the photo you posted at the top of your article, it looks to my tired old eyes that the ground netting was knotted by hand! Made me start thinking that I may have to try that sometime, it appeals to my sense of adventure
Thank you for working on this site for us all, you bring a great deal of fulfillment to so many!
Tracy
Yes, it’s definitely a hand-knotted net! 🙂